
Explore boundless trading opportunities with our cloud-based charting platform, the ultimate hub for analyzing forex, cryptocurrency, and stock markets. With this tool, you can take control of your trades like never before!
Set customized alerts and unlock a range of advanced features. Try this new charting software here.
Today’s lesson is going to be an interesting one.
We’ve been talking about Fibonaccis for quite some time now. And today, we’ll go over a strategy through which you can analyze any currency pair on multiple time frames to determine which direction the markets are likely to move.
What’s amazing about this strategy is that it’s simple and takes just a couple of minutes to use over various time frames on your charts.
Let’s dive in…
Analyzing USDJPY Across Time Frames with SmartFibs
Let’s take the USDJPY pair as an example.
For rapid analysis, we will analyze this currency pair on four different time frames – hourly, 4-hour, weekly, and monthly – to determine which direction the pair is likely going to move ahead.
Starting with the monthly chart…
USDJPY Monthly Chart
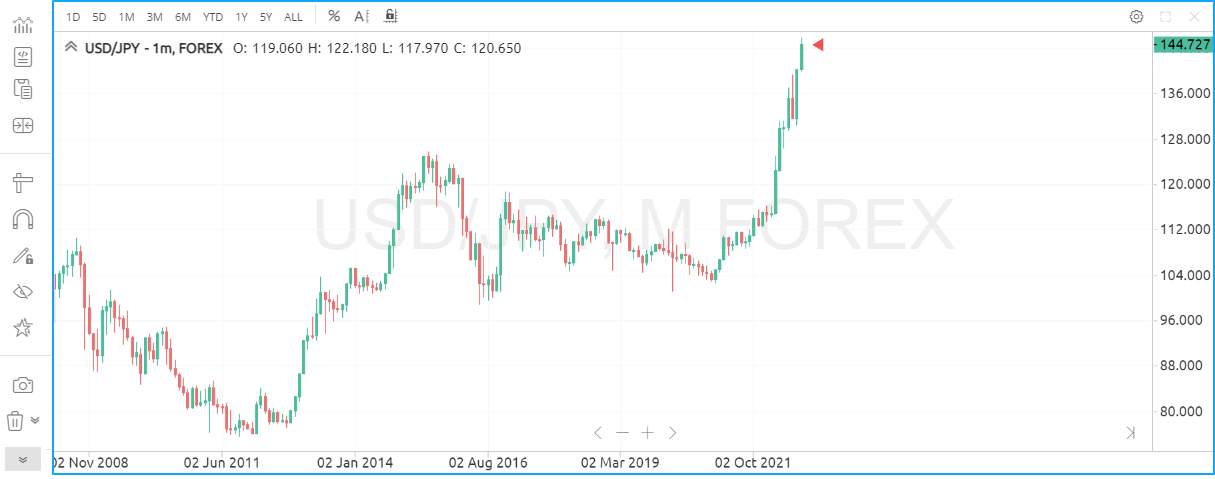
Source: MTI, SmartTrader
Starting with the monthly chart, the USDJPY shows a recent uptrend.
Here’s how you can apply Smart Fibonacci on it:
Open up a new chart on your SmartTrader trading platform on which you want to place the Smart Fibonacci.
Next, go to the indicators list located at the top of the chart and click on the ‘Smart Fib’ ABCD button.
Next, place your cursor below the recent lowest price level on the chart and click – this will automatically clock all the Fibonacci levels on your chart.
Here’s how it should look:
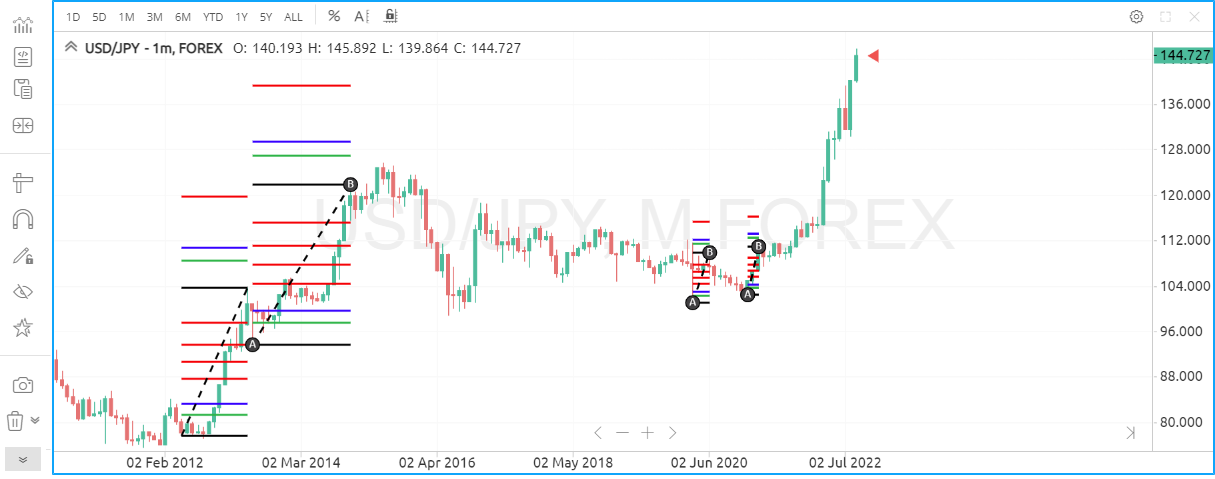
Source: MTI, SmartTrader
As seen in the chart above, we have an up AB line which shows that overall, the currency pair has been in an uptrend.
Now, stretch a smart trendline through the point A and extend to the next low level on the chart.
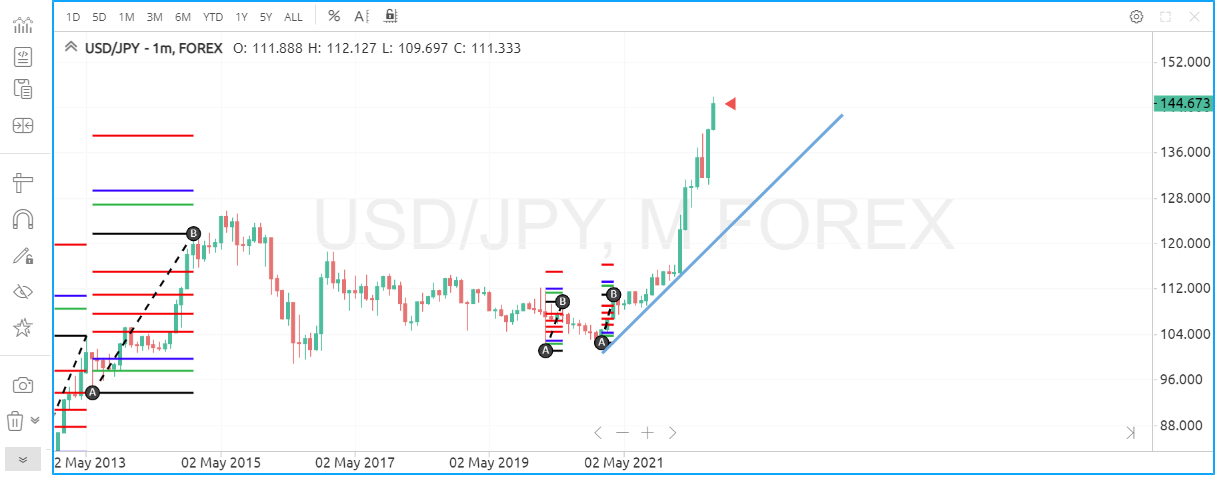
Source: MTI, SmartTrader
As seen in the chart above, there is no trendline break and that tells us the currency pair is likely to be moving in an uptrend ahead.
With that in mind, let’s now move on to the weekly chart.
That’s because the monthly chart controls the weekly direction, the weekly direction controls the daily direction, and the daily direction controls the 4-hour, and so on.
The steps remain the same – we place Smart Fibonacci on the chart, extend the trendline from lowest or highest level to the latest highs or lows, and see what direction it stretches out to.
Here’s a look:
USDJPY Weekly Chart
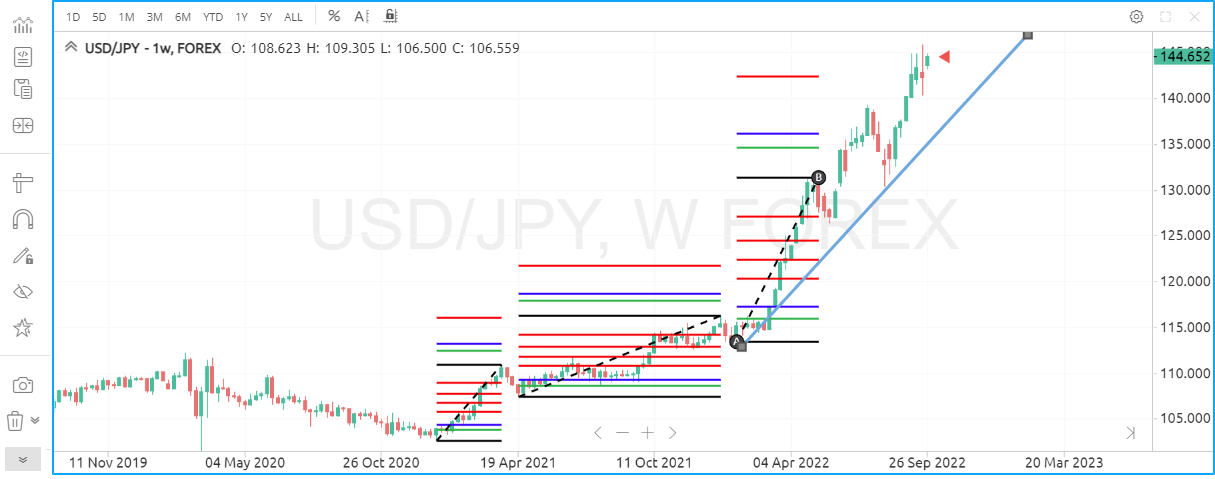
Source: MTI, SmartTrader
As we can see, there’s no trendline break in the weekly chart as well and that tells us the currency pair is likely to be moving in an uptrend ahead.
Similarly, we repeat the same exercise on the 4-hour and hourly chart for USDJPY.
If all the charts show us a similar pattern in the trendlines, we can determine how the currency pair is likely going to move ahead. And with that information, we can strategize our trades to target quick potential profits.
So there it is – a simple and quick way to analyze the direction of the market or any currency pair using Smart Fibonaccis on larger timeframes and moving on to smaller timeframes.
Do check it out the next time you’re on your charts!
By the way, our analysts are looking at some big, exciting trends in the current market. Click here to join them LIVE.
And don’t miss your Forex Cheat Sheet! Click here to download >>
Predictions are not a guarantee of this or any result. Information provided on this prediction is for general information purposes only. We offer no representation or warranty with regard to this prediction. No prediction is personalized or otherwise directed at any individual or particular circumstances. We disclaim and will not accept any liability for losses associated with this prediction.
Some of the information presented may be provided by a third party. MTI is not responsible for any claims, products, services, or information provided by any third parties. MTI does not provide any warranty or representation as to any third party data. MTI expressly disclaims any responsibility and accepts no liability with respect to such third party information, services, and/or products. The third party data is provided for convenience only and is in no way meant to imply an endorsement by MTI or any other relationship.
Please see our full risk disclaimer.

