
There are 4 Key Pillars to Forex Trading.
We have packed them in a compact, easy-to-digest course. We’re calling it the Forex Roadmap to Online Trading.
You will get a solid understanding of Forex trading, our best strategies for charting softwares, a trading account, and mentorship from a market expert.
Don’t miss this limited-time opportunity – Click here to access your course today!
Fibonacci retracement is a tool that traders use to help predict where the price of an asset might go in the future.
It’s based on something called the Fibonacci sequence, a series of numbers where each number is the sum of the two before it.
This might sound complicated, but it’s actually based on patterns that show up in nature all the time.
In trading, this sequence helps by turning into percentages, like 38.2% (often rounded to 0.382), 61.8%, and others.
These percentages are what traders look at on charts to figure out potential spots where the price is likely to change direction.
Think of these spots as invisible lines that the price might bounce off of or break through.
Here’s why this tool is super useful for traders:
- It helps guess future prices: By looking at past price movements and applying these percentages, traders can get a good idea of where the price might go next.
- It’s good for planning: Knowing possible future prices helps traders decide where to enter or exit a trade, which is crucial for managing risk.
- It works for many things: This isn’t just for one type of trading. Whether it’s stocks, currencies, or anything else, and no matter the time frame, Fibonacci retracement can be a handy tool.
To use Fibonacci retracement, traders pick two important points on a price chart (like a high point and a low point) and then draw lines at the key percentage levels between these points.
These lines are like markers or targets for where the price might head to next. The real value of using Fibonacci retracement is in its simplicity—it uses a natural pattern to make sense of price movements that often seem random.
Let’s learn more about this strategy.
Let’s dive in…
In the world of trading, Fibonacci retracement is a technical analysis tool used to predict support and resistance levels.
It’s named after Leonardo Bigollo – the man responsible for making Arabic numerals popular. He also shined a light on what he called “Spiritual Vibration” and the pattern of creation he was the first credited with measuring. The sequence itself gives light to his theory that the growth of numbers and adding them on to one another uncovers a unique pattern.
The Fibonacci sequence of numbers, whose ratios provide predictive price level patterns to which the market tends to react. Traders often place trades with this information to target potential profits.
The 0.382 Fibonacci Level
The 0.382 is a Fibonacci retracement level and it’s called the up retracement zone when it is in an uptrend or the down retracement zone when it is in a downtrend.
It’s a simple ABCD pattern which helps us predict where the market will go next based upon its location within the AB boundary on the Fibonacci.
In simple terms, the market often likes to treat this level like a magnet…until it gets there.
Here’s what this pattern looks like…
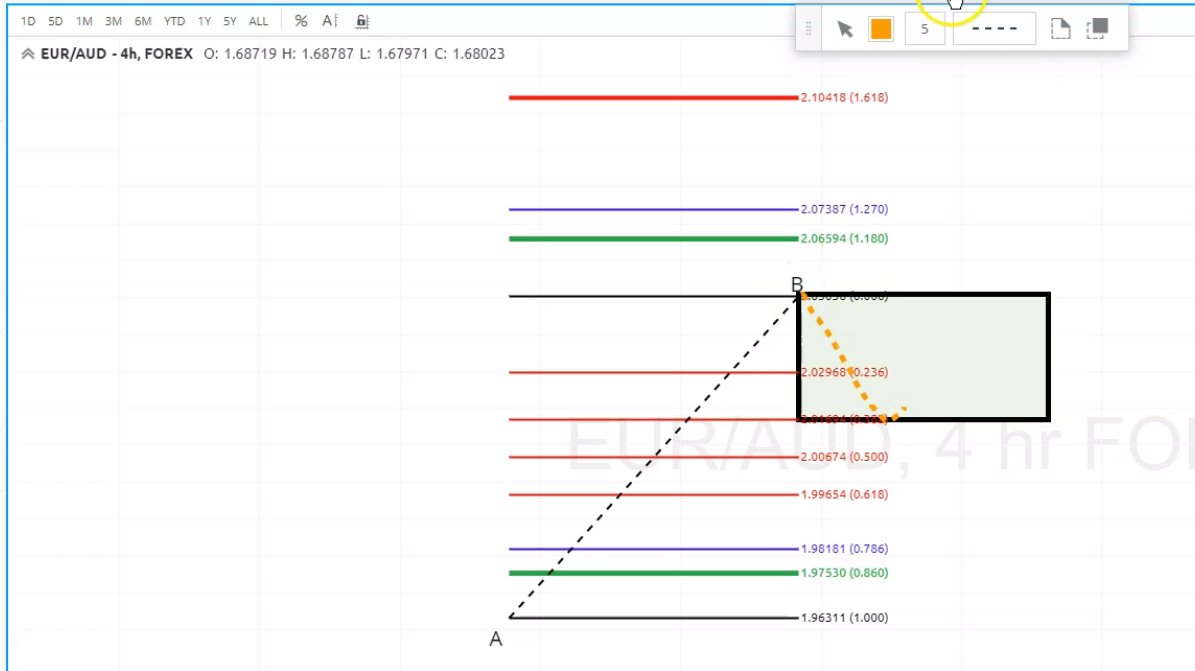
Market Reacting at the 0.382 Level
Source: SmartTrader, Market Traders Institute
As seen in the image above, the market rallies from A to B level and falls back to the 0.382 level.
You can see this type of pattern play out on all charts and on hourly, daily, weekly, and even monthly time-frames.
So, whenever we see the market (or any asset) passing forming a high or “B” level, we can predict there’s likely going to be a pull-back or retracement back to the 0.382 level.
Once we understand this, voila – we can now place our trades to target some quick potential profits OR make long term position plays.
Here’s how you can use this strategy on your charts…
Using Smart Fib on SmartTrader
Open up a new chart on your SmartTrader trading platform on which you want to place the smart Fibonacci.
Next, go to the indicators list located at the top of the chart and click on the ‘Smart Fib’ button. This step will automatically clock the Fibonacci levels on your chart.
Here’s how it should look:
Source: SmartTrader, Market Traders Institute
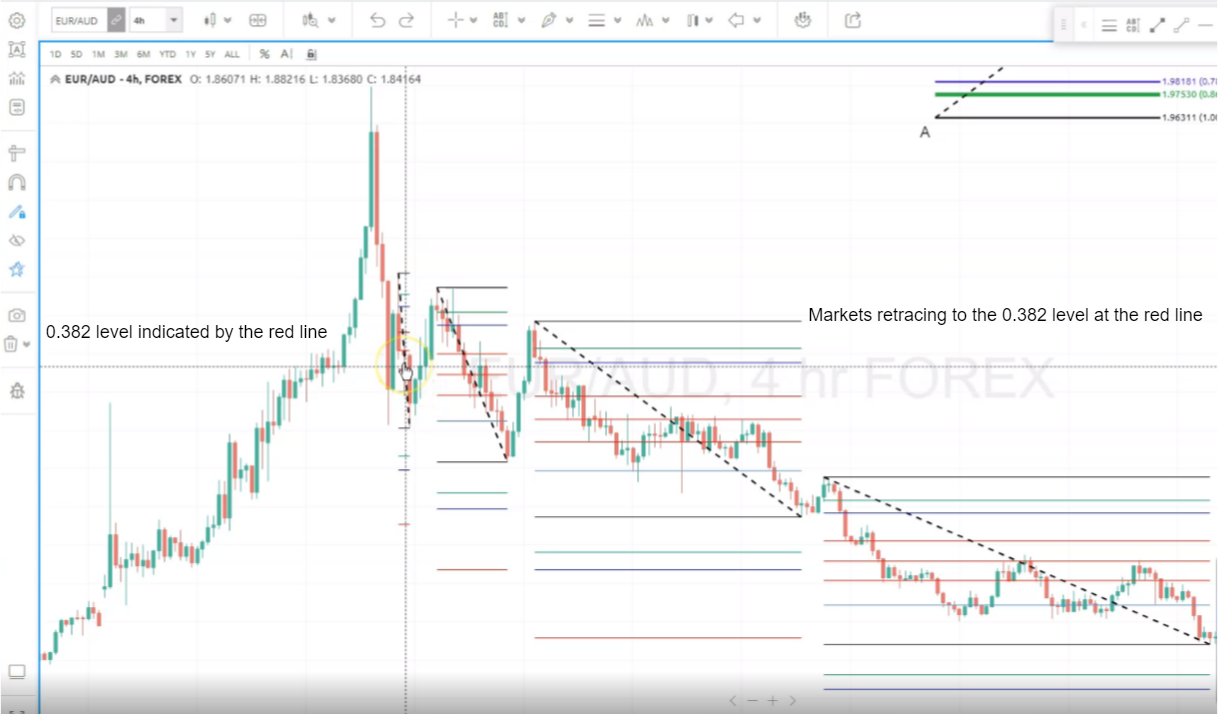
Now have a look at the 0.382 Fibonacci level that’s indicated with the middle red line and notice how the markets reacted at these levels.
After rallying, the markets retraced and came back to the 0.382 Fibonacci level.
What this signal shows us is that we can look to sell at the 0.382 level if the market is falling. So there’s a good chance that the market can retrace back to the 0.382 level and one can target potential profits at this level by setting up a sell trade.
Key Rules To Follow When Trading Fibonacci Retracements
When trading with Fibonacci retracement levels, there are some key rules that can help make the process more effective and potentially more profitable.
Let’s break them down:
- Always Have a Plan: Before you even start drawing those Fibonacci levels on your chart, know what you’re looking for and what you plan to do when you find it. This means setting clear targets for buying or selling and deciding in advance how much you’re willing to risk.
- Look for Confirmation: Don’t just rely on Fibonacci levels alone. Use other indicators or patterns to confirm what the levels are suggesting. This could be anything from looking at moving averages, checking volume levels, or even just waiting for a clear sign that the price is reacting to a Fibonacci level.
- Manage Your Risk: This can’t be stressed enough. Even if all signs are pointing to a successful trade, there’s always a chance things won’t go your way. Make sure you’re not risking more than you’re comfortable with losing on any single trade.
- Stay Flexible: The market is always changing, and what worked yesterday might not work today. Be ready to adapt your strategy as needed based on new information or changing market conditions.
- Use the Right Tools: Make sure you’re using a reliable trading platform that allows you to accurately draw Fibonacci levels and analyze other indicators.
- Be Patient: Sometimes, the price might come very close to a Fibonacci level but not quite touch it before moving in the direction you expected. Don’t rush to make a trade if things aren’t lining up perfectly. Waiting for the right moment is crucial.
So, that was one of the simple Fibonacci strategies which you can use to predict market trends and target some potential profits.
It’s an amazing indicator of the market trend and can play a key role in influencing the uptrends and downtrends on multiple time frames.
Do check it out the next time you’re on your charts!
If you’re looking to ace your Forex trading game, check out SmartTrader Prime.
It’s a powerful, cloud-based charting platform where you can create your ideal charting workspaces, access a range of indicators, and set custom alerts. You can get your all-access pass to SmartTrader Prime by clicking here.
For more simple-to-apply Forex strategies such as above, download our FREE ebook – The Ultimate Indicators Guide.
This expert guide shares senior analyst Tyson Clayton’s favorite tools that have helped the veteran pro find some of his most profitable trades. Click here to get your copy.
Predictions are not a guarantee of this or any result. Information provided on this prediction is for general information purposes only. We offer no representation or warranty with regard to this prediction. No prediction is personalized or otherwise directed at any individual or particular circumstances. We disclaim and will not accept any liability for losses associated with this prediction.
Some of the information presented may be provided by a third party. MTI is not responsible for any claims, products, services, or information provided by any third parties. MTI does not provide any warranty or representation as to any third party data. MTI expressly disclaims any responsibility and accepts no liability with respect to such third party information, services, and/or products. The third party data is provided for convenience only and is in no way meant to imply an endorsement by MTI or any other relationship.
Please see our full risk disclaimer.

