

by Chad Shoop
Chad is a Chartered Market Technician (CMT) who specializes in stock and options trading. For over 12 years, he’s led some of the largest trading research firms on the planet.
Major trends and patterns in the market don’t usually develop overnight.
But, much like the red car theory, once you know what to look for, you see it all over the charts.
The Red Car Theory suggests that once you become aware of something — like a red car — you start noticing it everywhere, even though its actual occurrence hasn’t increased.
That’s true for this key level that you can apply across all charts and asset classes today – the 200 Day Simply Moving Average.
It’s a classic indicator that is standard on almost any charting setup.
Since it is so popular, the moving average itself acts as key levels.
But for today, I want to show you the three charts I’m tracking to determine if 2025 is going to be a bear market, or hold out hope the bulls are still in control.
Let’s dive in.
All You Need to Know in Three Charts and One Indicator
I start with these three charts because they are going to tell you the overall trend that the stock market is in.
We’ll use the SPDR S&P 500 ETF (SPY), SPDR Dow Jones Industrial Average ETF (DIA) and the Invesco QQQ ETF (QQQ). These three ETFs track the largest most widely traded stocks in the market through the S&P 500 (SPY), the Dow Jones Industrial Average (DIA) and the Nasdaq 100 (QQQ).
If we are in a bull or bear market, these charts will show us exactly that.
And right now, it’s a bit up in the air.
Here’s what I mean.
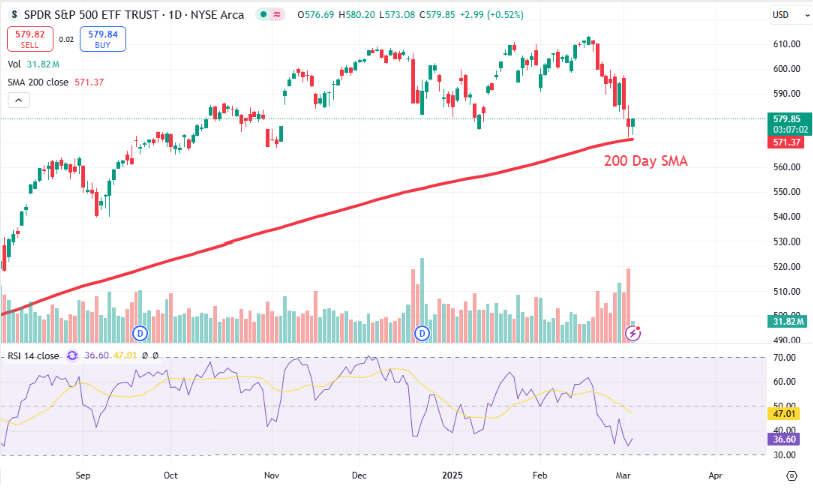
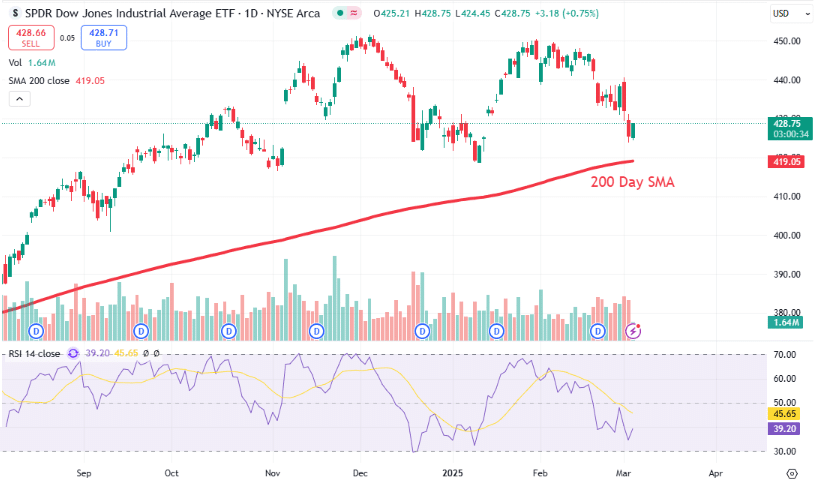
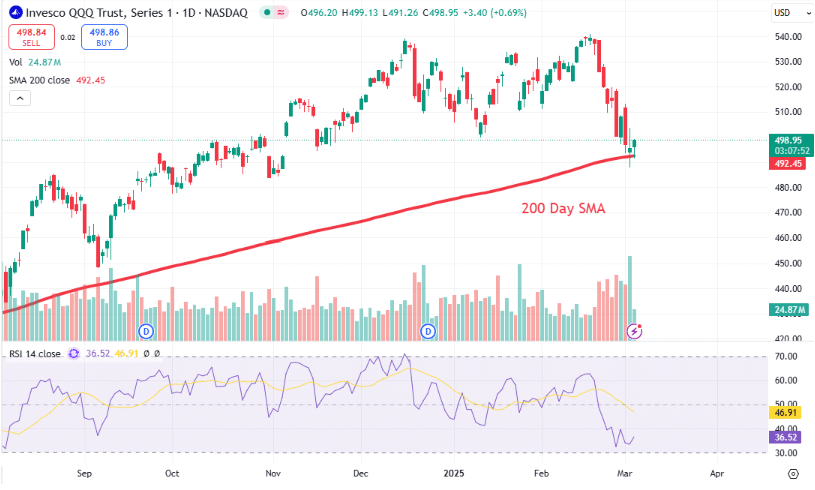
When you look at these charts, the recent volatility has not only stalled the strong rally from 2024, but it has also brought back into the picture the one key indicator we are tracking today – the 200 Day Simple Moving Average.
Take a look:
SPDR S&P 500 ETF (SPY) Price Chart
SPDR Dow Jones Industrial Average ETF (DIA) Price Chart
Invesco QQQ ETF (QQQ) Price Chart (SPY) Price Chart
Now, if you are panicking on the recent drawdown, you are in the wrong field.
These major indexes are not even in correction territory yet – and that’s what alarms me.
See, if we see any more selling pressure across the three broad indexes, well, we are set to dip below their respective 200 Day Simple Moving Averages.
That’s bad news for investors who were hoping 2025 was going to be another solid year for the market.
A bear market would signal short-term declines around 20%, compared to the 5%-6% pullback we have seen so far out of the S&P 500.
And it also puts back into the picture the idea of even larger drawdowns (peak to trough) like we experience back in the 2008 Global Financial Crisis, where 50% or greater broad market declines are possible.
Don’t Panic Just Yet
I’m not saying these things to alarm you.
Instead, I want you to have the tools and resources available, such as the 200 Day Simple Moving Average, to know what the expectation for 2025 will be.
As long as this can hold as support, across these three major indexes, 2025 is still set to generate robust returns as the bull market continues.
And if that fails to hold as support, well, there will be lower levels reached in 2025.
Since I have a trader’s mindset, I’m just as happy to profit from a stocks decline as I am a stocks rally. So, I’ll continue to play both sides of this market and profit regardless of the outcome.
If you are more of an investor, well you should be just as excited to. The main thing we are looking for is certainty. While we can’t have that 100%, once we know the likelihood is for stocks to go lower, you can look to put more capital in cash, and take advantage of dips if that’s the case – the generational buying opportunities that it presents.
At the end of the day, our experts at Market Traders Institute will be here to help you navigate this turbulent market environment.
Click here if you want to learn more about how we lead traders through 2025.
#StockMarket #Investing #Trading #MarketTrends #BullMarket #BearMarket #Finance #SP500 #NASDAQ #DowJones #StockTrading

