
Explore boundless trading opportunities with our cloud-based charting platform, the ultimate hub for analyzing forex, cryptocurrency, and stock markets. With this tool, you can take control of your trades like never before!
Set customized alerts and unlock a range of advanced features. Try your new trading software here.
Curious about how to predict which way the market wind will blow next?
Well, you’re in luck!
Today, we will be diving into a topic that’s a game-changer in the Forex world: figuring out the strength of currencies.
Analyzing currency strength can be a valuable tool for Forex traders as it can help them predict which direction a currency could move. It’s like having a compass in the vast ocean of Forex trading, guiding you towards more informed decisions.
Let us learn how you can find this on your charts for a particular currency pair for a certain timeframe.
Determining the Currency Strength
When we talk about currency strength, we’re looking at how strong or weak a currency is compared to others.
This is important because in Forex trading, you’re dealing with pairs of currencies. You buy one currency and sell another. Knowing which one is likely to go up or down can help you choose the right pairs to trade.
The currency strength or weakness indicator helps determine the relative strength of currencies. It uses the real-time exchange rates for a certain period to measure the aggregate and comparable strength of a particular currency.
In simple terms, the indicator is a tool that can predict how strong, or how weak a currency is right now or may be in the future.
Finding Currency Strength On Charts
Now, there are many ways and tools through which you can determine the relative strength of currencies.
Here’s how it works on your SmartTrader platform:
Open up a new currency chart on your SmartTrader trading platform for which you want to know the strength.
Now, to find the strength, all you have to do is add the daily encapsulations on the chart. This will give us boxes on the chart that will indicate the price movement for each day.
Just click on the ‘SmartTools’ and then the ‘Daily Encapsulation’ buttons and your SmartTrader chart will show you boxes on the selected chart.
Here’s how it should look:
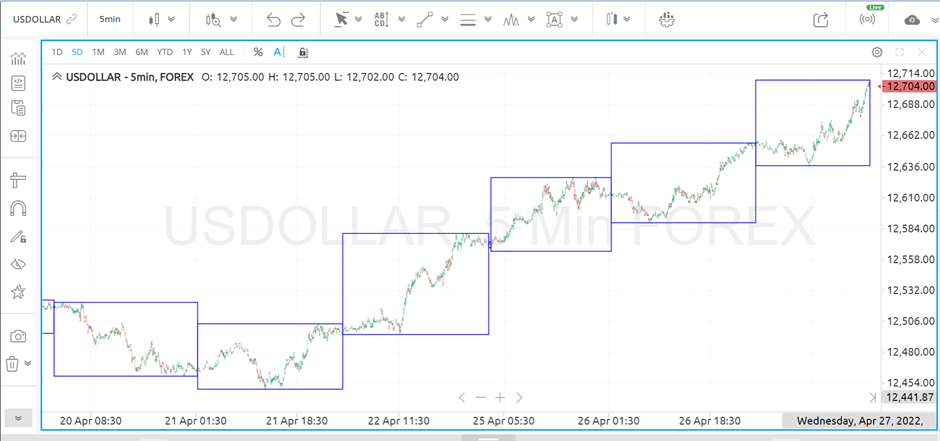
Source: SmartTrader, MTI
All these boxes indicate the price movement for each day or a certain period for a particular currency.
For instance, the above boxes in the chart represent the price movement for the U.S. Dollar (USD) during various days. And the last box shows us that the dollar is bullish and moving up in the current day’s session.
Comparative Strength Analysis
SmartTrader also lets you compare the strength of different currencies or a currency against other financial instruments like stocks or commodities.
To do this, head on to the ‘Compare’ button and choose the instrument you want to compare any currency with. This will show you how that instrument moved in comparison to the currency during the selected days.
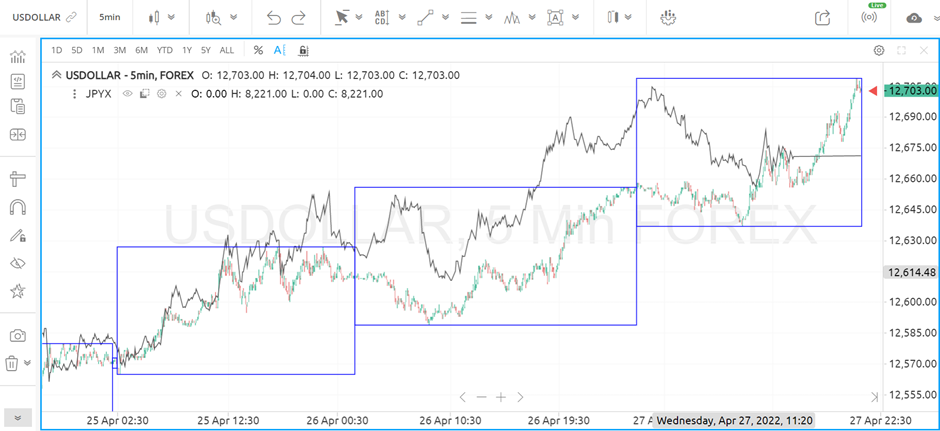
Source: SmartTrader, MTI
The chart shows how the JPYX has moved against the USD during the various days which are represented in boxes.
The last box tells us that while the dollar has been consolidating and rising that day, the JPYX has been falling. And that means the JPYX may have less strength as compared to the dollar in that day’s trade.
You can add further currencies or instruments on this chart to compare them with the other already plotted currencies.
So, that was one of the many ways in which you can determine the strength of a currency pair to help you make better trading decisions. If you see a currency is strong, you might decide to buy it against a weaker one, which can increase your chances of making a profitable trade.
Do try to notice these and follow them the next time you’re on your Forex charts!
Our top analysts are going through their top FX trends and strategies in their trading rooms. You can see them LIVE in our upcoming webinar by clicking here.
And if you wish to get trade setups and learn effective market strategies, check out the Equities on Demand Trading Room.
It’s where our pro analysts – Tyson Clayton and Chris Pulver – take you through real market conditions and guide you on your journey to becoming a consistent trader across the board. Try it here.
Predictions are not a guarantee of this or any result. Information provided on this prediction is for general information purposes only. We offer no representation or warranty with regard to this prediction. No prediction is personalized or otherwise directed at any individual or particular circumstances. We disclaim and will not accept any liability for losses associated with this prediction. All trading carries substantial risk.
Some of the information presented may be provided by a third party. MTI is not responsible for any claims, products, services, or information provided by any third parties. MTI does not provide any warranty or representation as to any third party data. MTI expressly disclaims any responsibility and accepts no liability with respect to such third party information, services, and/or products. The third party data is provided for convenience only and is in no way meant to imply an endorsement by MTI or any other relationship.
Please see our full risk disclaimer.

