
Senior analysts Tyson Clayton and Chris Pulver explain their strategy for trading the trend that follows the volatility squeeze in stocks, forex, and cryptocurrencies.
Tyson and Chris are the creators of the groundbreaking Equities on Demand training program, which seeks to help you master your equities and options trading game. For more information, watch our Equities on Demand video here.
Understanding market trends is the holy grail for traders in the dynamic world of Forex, stocks, and crypto.
It’s the compass that guides us, revealing the likely direction of asset prices with precision.
Today, we’re about to delve into a strategy that leverages price movements and key indicators to uncover the trends in virtually any asset. The best part? You can learn and apply this strategy to target potentially lucrative trades.
So, let’s get right into it…
The Volatility Expansion Strategy
Imagine having the power to predict an asset’s future price movements by analyzing its volatility.
That’s precisely what the volatility expansion strategy offers. It’s a powerful tool that assists traders in identifying potentially profitable opportunities by spotting sudden surges in volatility.
The rationale here is that a sudden thrust in the volatility can predict further price movements for an asset. And this helps traders a great deal to position potentially successful trades.
While there are a lot of unknowns within the market, there’s one thing that’s certain, which is periods of low volatility have always been followed by expansions of volatility.
Take a look at the image below, showcasing the price movements of JPM.
Each circle represents a period of low volatility. But interestingly, right after these phases, the price saw huge drawdowns or surges representing high volatility or expansion in volatility.
Volatility Expansions After Low Volatility for JPM
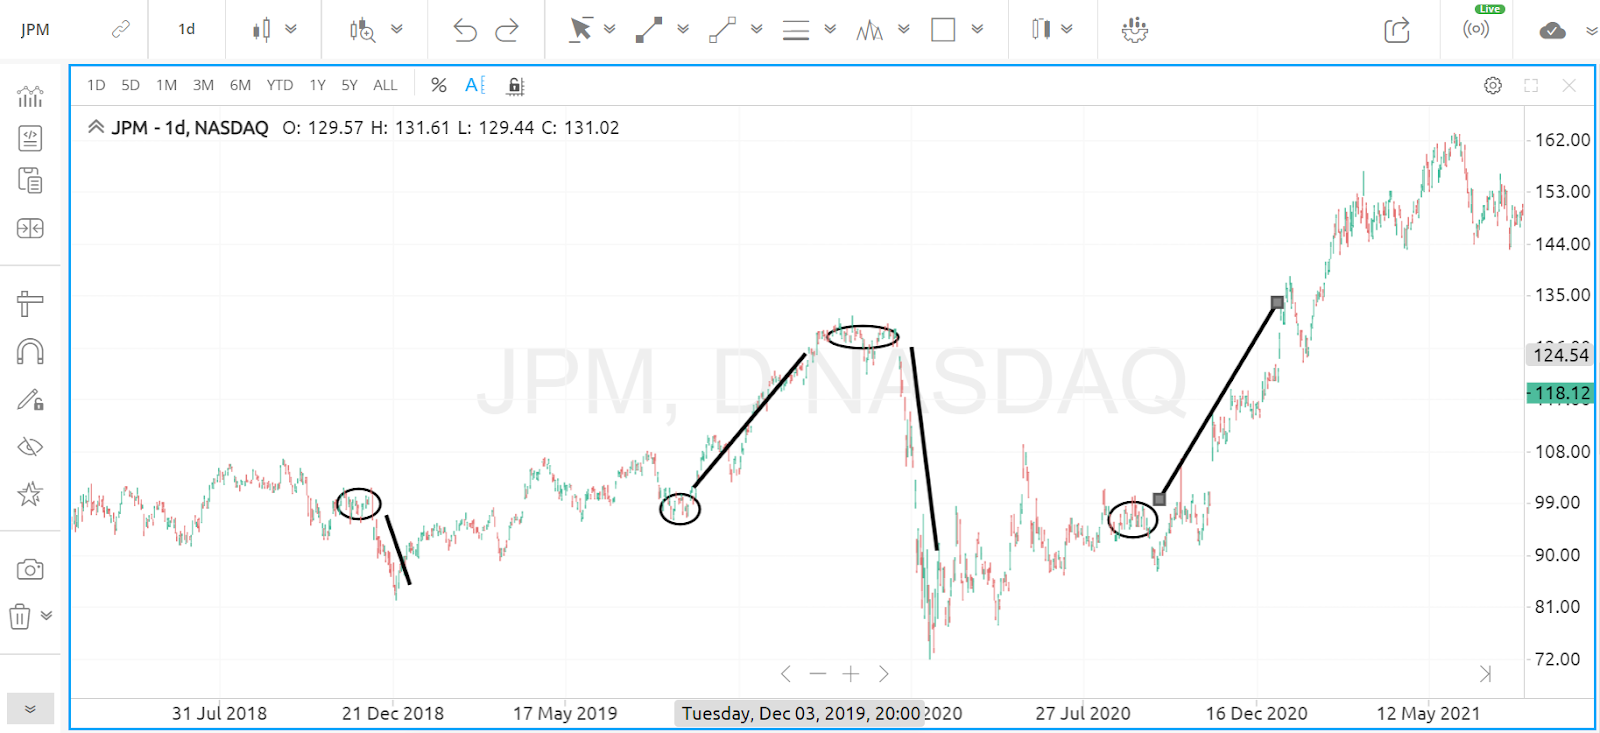
Source: MTI, SmartTrader
Now, apply this pattern to a stock, currency pair, or cryptocurrency, and you’ll notice a similar trend across all these markets. Phases of low volatility have been followed by expansions of volatility. And this is what we call a volatility squeeze in the market.
But here’s the catch: while we can anticipate a volatility squeeze, we can’t definitively predict whether it will lead to an upward or downward price movement.
Here’s the strategy we’ve developed to trade this situation…
The Master Blaster Indicator
This indicator shows when the markets are likely to explode. It uses a combination of volatility bands along with ratios to flash signs when the markets look set to see volatility expansion.
Here’s how we can trade this situation:
- Indicator Alert: When the Master Blaster Indicator signals volatility expansion, take note.
- ATR Calculation: Take the Average True Range (ATR) of the asset you’re trading and multiply it by 75%. The number you now have is how much you could expect the price of the asset to rise or fall.
The ATR above mentioned refers to a technical analysis indicator calculating market or price volatility. It helps analyze the volatility involved in price changes of any security, and then it selects the best time for trading and to achieve consistency in trading.
- Execute Trades: The next step is to BUY Calls and Puts at the current price level of the stock and SELL those Calls and Puts at the expected price levels of the stock which you calculated above with the help of ATR.
- Set Targets: Establish your trade targets at 60% of the ATR value.
This strategy offers a historically effective trade setup, as demonstrated by top analysts Tyson Clayton and Chris Pulver in the Equities On Demand Trading Room.
That was just one of their historically effective trade setup strategies.
For more insights, you can watch this short video where Tyson trades JPM using the Master Blaster Indicator and takes you through his detailed trade setup behind it.
By the way, our analysts are looking at some exciting setups on their charts in the current market. Click here to see it and join them LIVE.
And don’t miss your Forex Cheat Sheet! Click here to download >>
Predictions are not a guarantee of this or any result. Information provided on this prediction is for general information purposes only. We offer no representation or warranty with regard to this prediction. No prediction is personalized or otherwise directed at any individual or particular circumstances. We disclaim and will not accept any liability for losses associated with this prediction.
Some of the information presented may be provided by a third party. MTI is not responsible for any claims, products, services, or information provided by any third parties. MTI does not provide any warranty or representation as to any third party data. MTI expressly disclaims any responsibility and accepts no liability with respect to such third party information, services, and/or products. The third party data is provided for convenience only and is in no way meant to imply an endorsement by MTI or any other relationship.
Please see our full risk disclaimer.

