
Click here to meet some of our top analysts. You will gain access to their simple yet highly effective market strategies currently in use.
[Check the workshop schedule >>]
In the trading arena, the difference between success and mediocrity often hinges on having an edge.
This edge can come from predicting the perfect price point of an asset, enabling informed entry and exit decision-making and profit targeting.
So, let’s have a look at a powerful indicator that not only gauges market value but also offers a strategic way to potential gains.
Here we go…
Demystifying Stochastic RSI
The Stochastic RSI is a gamechanger in markets. It’s a technical analysis indicator which is used to determine whether an asset is overbought or oversold, as well as to identify the market trends.
It’s the GPS of trading, guiding you on when to enter the market, what levels to set your sights, and when to gracefully exit.
As the name suggests, Stochastic RSI is derived from the classic Relative Strength Index (RSI), and therefore it is also considered an “indicator of an indicator”.
So, it combines two popular indicators: the RSI and the Stochastic Oscillator. As such, the Stochastic RSI is designed to provide more sensitive and timely signals than the standard RSI.
Here’s how it works:
- Calculate the RSI: First, you calculate the RSI for a given period (typically a 14-day average) which measures the strength and momentum of an asset’s price movements. (For example, if in the last 14 days, there were 10 up days and 4 down days, we will take the average gain on the 10 days and divide it by 14, and then use the average loss of 4 days and divide it by 14)
- Calculate the Stochastic Oscillator for the RSI: The Stochastic Oscillator measures the relative position of the RSI within its recent range. This involves calculating the highest RSI value and the lowest RSI value over a certain lookback period.
- Calculate the Stochastic RSI: Finally, the Stochastic RSI is computed using the Stochastic formula applied to the RSI values. This calculation results in a value that oscillates between 0 and 100.
Traders commonly use the following thresholds to read this:
- A reading above 80 is considered overbought, suggesting that the asset may be due for a price reversal to the downside.
- A reading below 20 is considered oversold, suggesting that the asset may be due for a price reversal to the upside.
The divergence between the price and the Stochastic RSI is often a potential signal. For example, if an asset’s price is making higher highs, but the Stochastic RSI is making lower highs, it may indicate a weakening trend.
Let’s review how we can use this tool to help us place trades…
Mastering Stochastic RSI
The crux of understanding Stochastic RSI lies in identifying overbought and oversold conditions. These thresholds are marked at 0.80 for overbought scenarios and 0.20 for oversold conditions.
And identifying these conditions isn’t as daunting as it sounds. All you have to do is find out if the stochastic RSI is moving below or above these conditions and you’re all set.
Here’s how you can predict overbought and oversold conditions in a snap…
Have a look at the RSI graph below the chart in the following image:
Stochastic RSI Indicating Oversold Zones
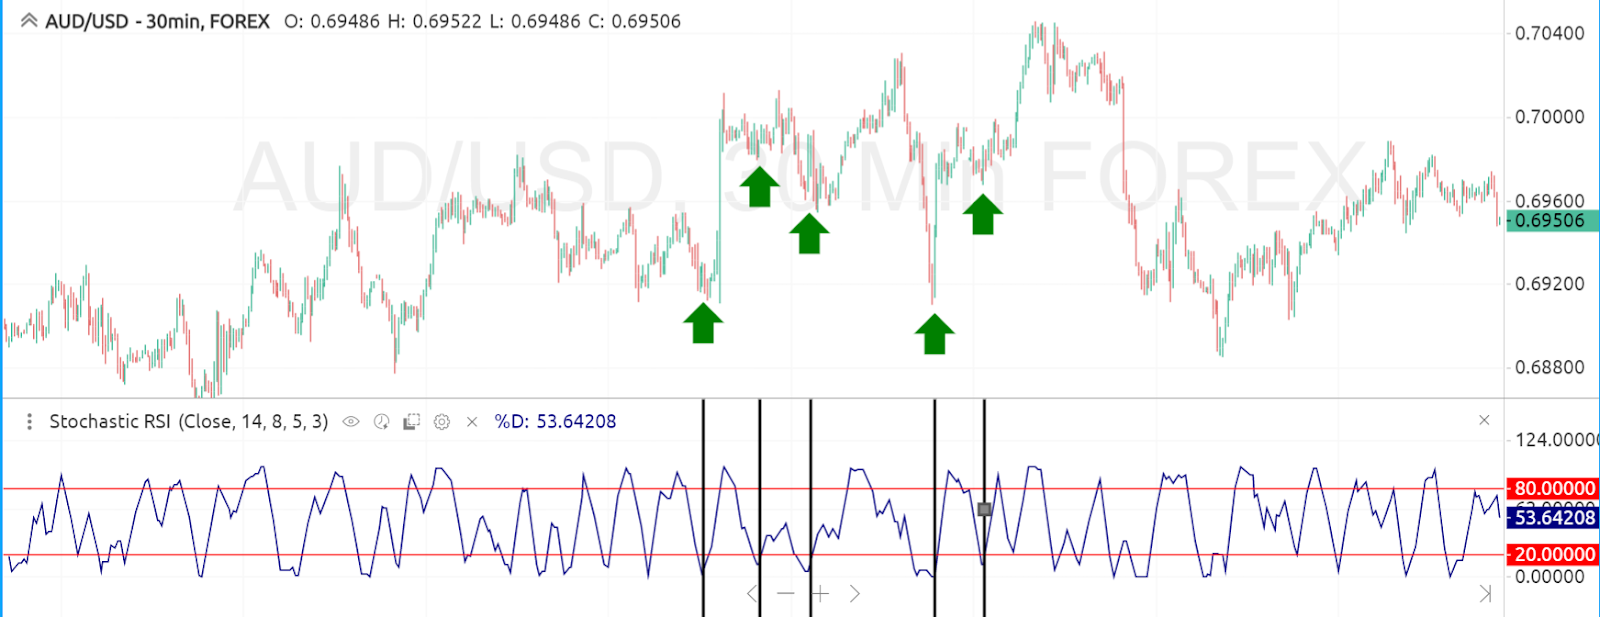
Source: SmartTrader, Market Traders Institute
When the blue line touches or moves below the lower red line, we know we are in an oversold zone.
In this terrain, it’s prime time to contemplate a BUY action.
Why? Because at these levels, there’s minimal selling pressure, and the asset’s prospects for an upward surge shine brightest. And this setup works best when the asset or the market is in an uptrend.
So, you are buying when there’s less selling of the asset and also relying on the momentum of the asset which is the uptrend.
Now shift your attention to the upper red line in the graph below the chart in the following image:
Stochastic RSI Indicating Overbought Zones
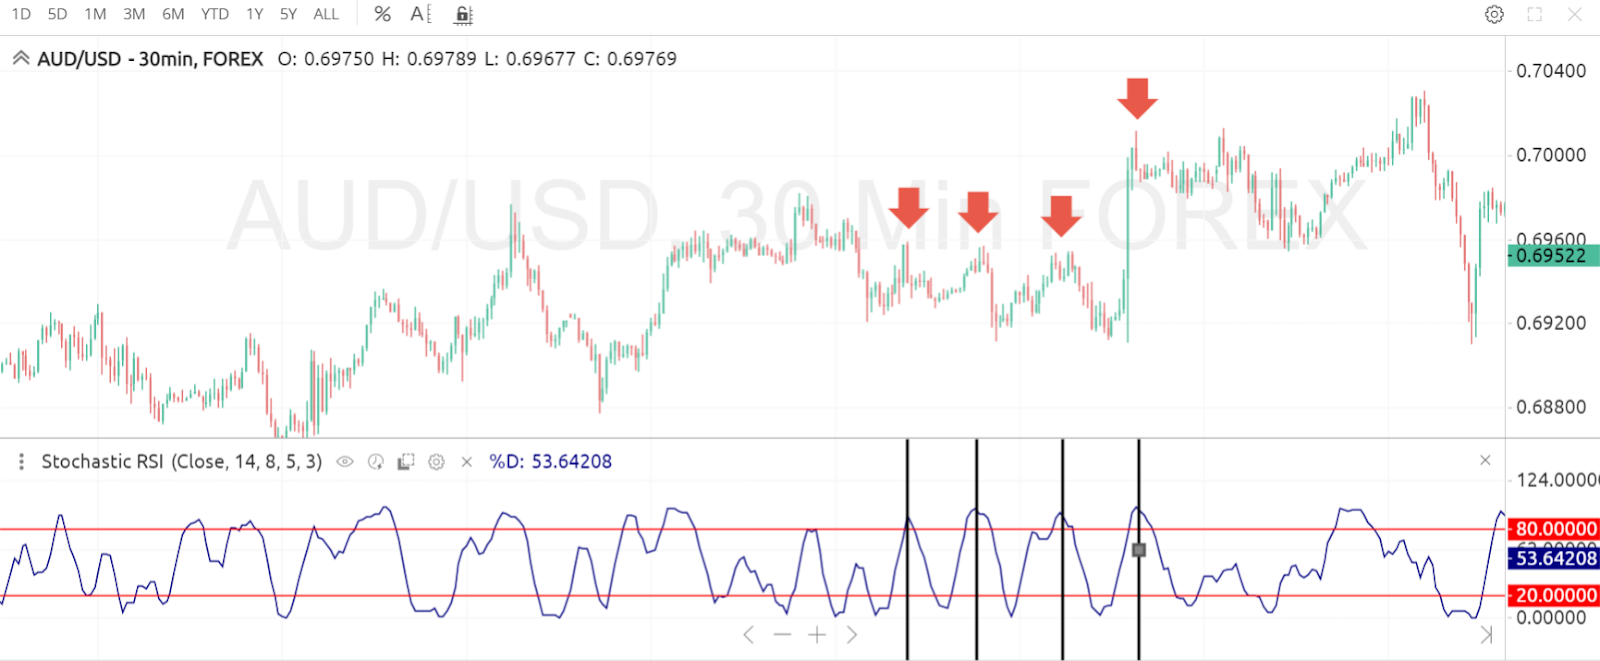
Source: SmartTrader, Market Traders Institute
When the blue line touches or moves above the upper red line, it’s your cue that we are in an overbought zone (or the markets are overbought). Here, the decision is clear – to initiate a SELL action at these levels.
We aim to sell because the market or asset doesn’t have much buying interest left at these levels and has greater chances of falling.
This setup works best when the asset or the market is in a downtrend.
So, the two things to remember while using the RSI are…
- Look to Buy in an Uptrend when we’re at or below the Lower dotted line
- Look to Sell in a Downtrend when we’re at or above the Upper dotted line
Using Stochastic RSI on SmartTrader
Getting hands-on with Stochastic RSI through SmartTrader is simple:
- Open a currency chart on your SmartTrader platform – choose the one you’re keen on for Stochastic RSI insights.
- Head to the indicators list on the left-hand side, and tap on the ‘Add Indicators‘ button.
- Type ‘Stochastic RSI‘ in the pop-up search bar, and you’re almost there.
- Finally, hit the ‘+’ button for the MTI Stochastic RSI, and you’re good to go!
And there it is, your Stochastic RSI indicator nestled at the bottom of your chart, ready to decode asset value and guide your trading maneuvers.
A simple yet invaluable companion for your trading journey.
The Stochastic RSI Indicator
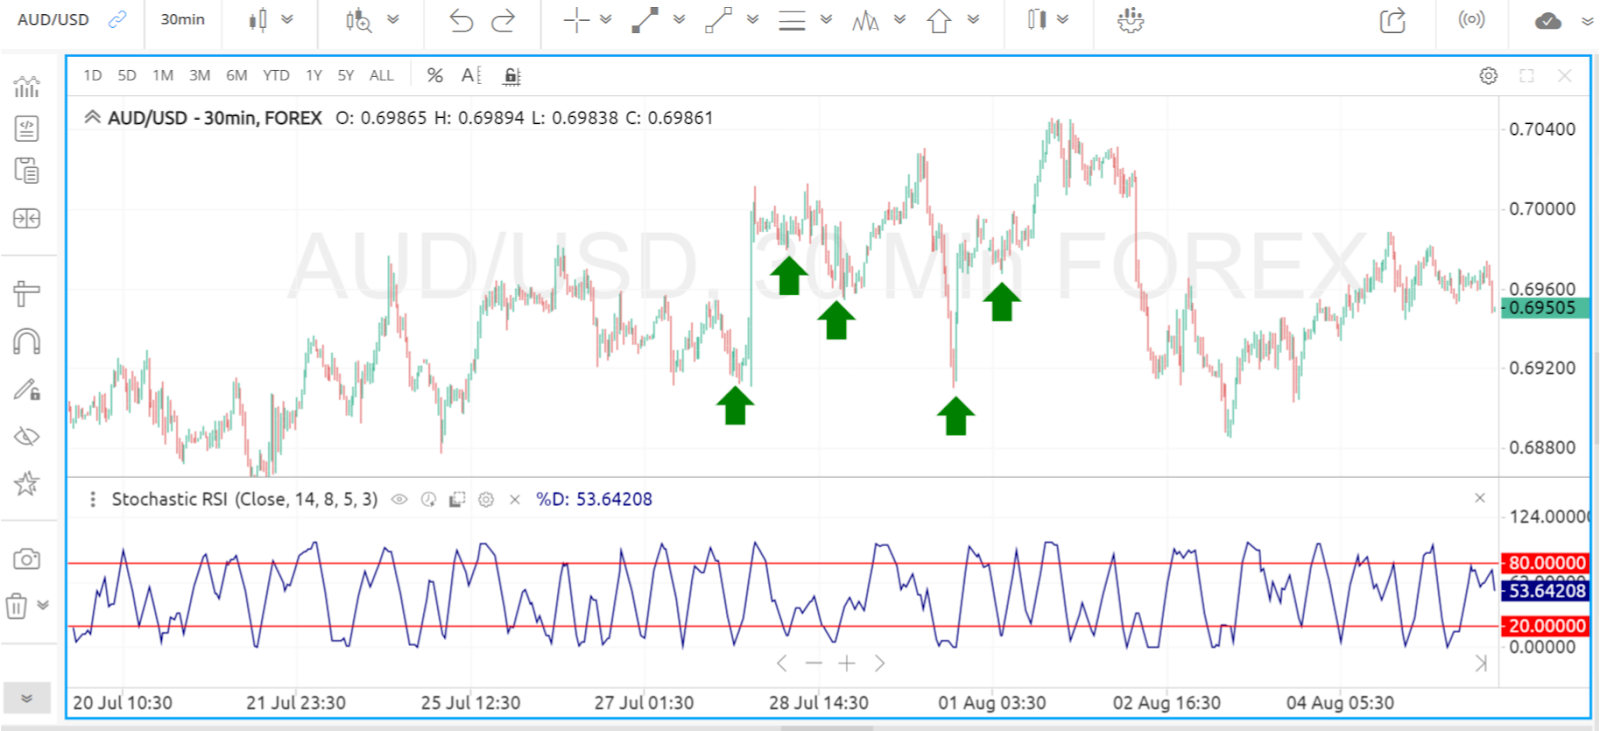
Source: SmartTrader, Market Traders Institute
So, that’s why stochastic RSI is a simple way to help you identify if an asset is in an overbought or oversold zone and place trades accordingly to target potential profits.
Check it out the next time you’re on your charts!
By the way, if you’re looking to ace your Forex trading game, you must check out SmartTrader Prime.
It’s a powerful, cloud-based charting platform where you can create your ideal charting workspaces, access a range of indicators, and set custom alerts.
You can get your all-access pass to SmartTrader Prime by clicking here.
For more simple-to-apply Forex strategies, we’ve got a gift for you. Download our FREE ebook to uncover these gems and avoid the critical trading mistakes that even the best traders have made. Click here to get your copy >>
Predictions are not a guarantee of this or any result. Information provided on this prediction is for general information purposes only. We offer no representation or warranty with regard to this prediction. No prediction is personalized or otherwise directed at any individual or particular circumstances. We disclaim and will not accept any liability for losses associated with this prediction. All trading carries substantial risk.
Some of the information presented may be provided by a third party. MTI is not responsible for any claims, products, services, or information provided by any third parties. MTI does not provide any warranty or representation as to any third party data. MTI expressly disclaims any responsibility and accepts no liability with respect to such third party information, services, and/or products. The third party data is provided for convenience only and is in no way meant to imply an endorsement by MTI or any other relationship.
Please see our full risk disclaimer.

