Whether you’re a new or experienced trader pursuing your dream lifestyle, joining a trading room could help show you the skills you need to master virtually any market strategy. Click HERE to meet some of our top analysts and discover what makes each of their trading rooms so unique.
Are you passionate about the financial markets but uncertain about their next move?
Our professional analysts thrive on tackling this uncertainty by trading in various market conditions – whether they’re rising, moving sideways, or falling. Check out their trading strategies here👉
One way they aim to effectively trade these markets is to trade the volatility with some time-tested indicators, tools, and strategies.
Today, let’s dive into one such indicator designed to gauge market sentiment about future volatility.
The exciting part? You can leverage this indicator to make trades in both the stock and Forex markets, targeting potentially quick profits based on its readings.
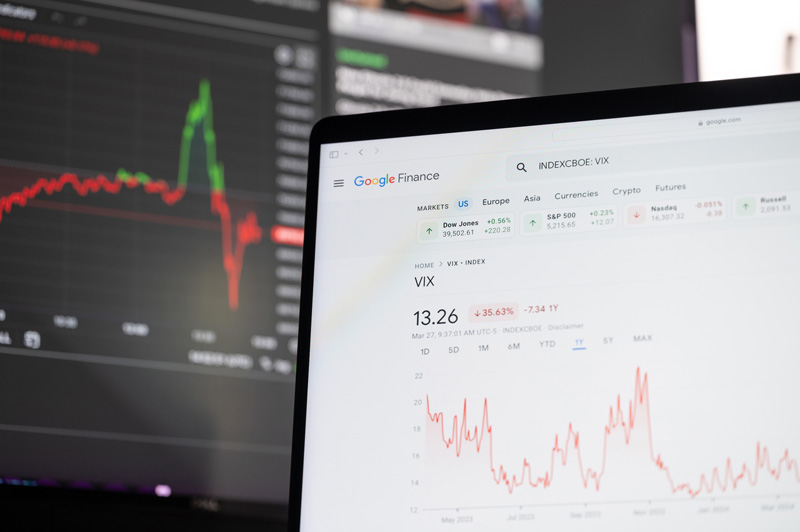
The VIX Index
The VIX Index is a measure of the stock market’s volatility, commonly referred to as the “fear index.”
It’s a real-time volatility index, created by the Chicago Board Options Exchange (CBOE), and it was the first benchmark to quantify market expectations of volatility.
The index is forward looking, meaning it shows the implied volatility of the S&P 500 (SPX) for the next 30 days.
VIX and the markets
The VIX is calculated using the prices of index options on the S&P 500 stock index (SPX).
This is because the price of options is considered a good measure of volatility. If something concerns the market, traders and investors tend to start buying options, which causes prices to rise.
Therefore, the VIX has an inverse relation with the stock market and it tends to move in the opposite direction to the broad market sentiment.
If the VIX value increases, it is likely that the S&P 500 is falling due to increasing investor fear.
Conversely, if the VIX value declines, then the S&P 500 is likely to be experiencing stability and investors are relatively bullish.
So…
High VIX = High Volatility = Market Fear
Low VIX = Low Volatility = Market Optimism
VIX Reading
Historically speaking, a VIX below 20 indicates that the market is forecasting a rather healthy and lower risk environment.
Whereas if the VIX heads higher than 20, then fear is likely starting to enter into the market and it is forecasting a higher risk environment.
The historical points of the VIX were during the height of the great housing crisis in 2008 and 2009 when it rocketed to levels far above 50.
So, how can one trade the markets using the VIX reading?
Trading Forex with the VIX reading
There’s a traditional mantra that says ‘When the VIX is high, it’s time to buy. When the VIX is low, look out below.’
When the VIX goes up in value, it indicates that the price of S&P 500 is likely falling and the value of SPX put options is increasing.
During these times, investors are uncertain or fearful about the stock market and therefore one can look to buy at these levels.
This is because when there’s a high level of volatility in the market, a bottom or support level has been found and the market is likely going to change direction. And hence, the common action is to buy when the VIX reaches high levels.
Similarly, when the VIX goes down, it means the market is experiencing higher stability and may be reaching a resistance level.
Therefore, the market can change its direction from the highs and the common action here is to sell to target some potential profits.
VIX and the Forex
As for the Forex markets, it must be remembered that the VIX pertains to the volatility of S&P 500 index options. So, if you are trading currency pairs based on this indicator, you have to check that the currency pairs are at least broadly correlated with the S&P 500.
For instance, if the USD/JPY currency pair is broadly correlated with the S&P 500, we can look at the current VIX reading and look to place trades based on what the VIX is telling us about the upcoming market movement.
If the VIX reading is high when both the USD/JPY and S&P 500 are in a bear market, then it could signal that both markets have reached their bottom and may stage a rally at any time. And with that reading, one can look to buy the USD/JPY pair to target some quick potential profits.
On the other hand, if the VIX reading is low, and both the USD/JPY and S&P 500 are in a bull market, it could signal that both these markets have reached their highs and may witness a correction. The strategy with this reading would be to sell the USD/JPY pair.
So there you have it – a simple yet effective way to strategize your trades in the stock and the Forex markets after gauging the market sentiment in coming days.
Do check it out the next time you’re on your charts!
Our top analysts have been reading a few setups along with the VIX index and their charts suggest there’s a breakout for a particular currency pair. Click here to see their market strategy.
Predictions are not a guarantee of this or any result. Information provided on this prediction is for general information purposes only. We offer no representation or warranty with regard to this prediction. No prediction is personalized or otherwise directed at any individual or particular circumstances. We disclaim and will not accept any liability for losses associated with this prediction. All trading carries substantial risk.
Some of the information presented may be provided by a third party. MTI is not responsible for any claims, products, services, or information provided by any third parties. MTI does not provide any warranty or representation as to any third party data. MTI expressly disclaims any responsibility and accepts no liability with respect to such third party information, services, and/or products. The third party data is provided for convenience only and is in no way meant to imply an endorsement by MTI or any other relationship.
Please see our full risk disclaimer.

