
Check out this sleek trading software if you are serious about trading the markets with more efficiency.
It’s a charting tool that lets you analyze the Forex, Crypto, and Stocks all at one place. Plus, it also lets you set alerts that can trigger trades on virtually any part of your trading strategy and many more amazing features!
Get your access by clicking here >>
The trend, they say, is a trader’s friend. And it rightly is!
Every trader wants to identify trends in the market to position themselves for potentially profitable entry and exit points.
While identifying a trend and gauging its strength isn’t a straightforward task, there are many simple ways in which you can quickly determine the direction of a trend.
That’s what we will be talking about today.
But first, let’s demystify trend analysis and its significance in traders’ pursuit of potential profits.
Decoding Trends: What Are They?
A trend is essentially the general direction in which the prices of a financial instrument move over a specific period.
These trends can vary in duration – they might be short-term, long-term, upward (known as an uptrend), downward (a downtrend), or even sideways.
In the trading world, traders aim to identify these trends to buy high-performing assets in uptrends and sell underperforming ones in downtrends.
The core belief in trend trading is that instruments or securities that have been rising will continue to rise and vice versa.
The objective is to align with the trend, finding opportunities to buy in an uptrend and sell in a downtrend or when a trend shows signs of exhaustion.
The Swift Path to Identifying Trends
Imagine you want to determine the trend for the EURUSD currency pair. Well, there’s a simple and efficient method to do this using the SmartTrader trading platform.
Here’s how:
- Open a daily EURUSD currency chart on your SmartTrader platform.
- To spot the trend, add a ‘Simple Moving Average‘ to your chart.
Simply right-click on the chart, choose ‘Indicator,’ select ‘General,’ and search for ‘Simple Moving Average.’ Add it to your SmartTrader chart.
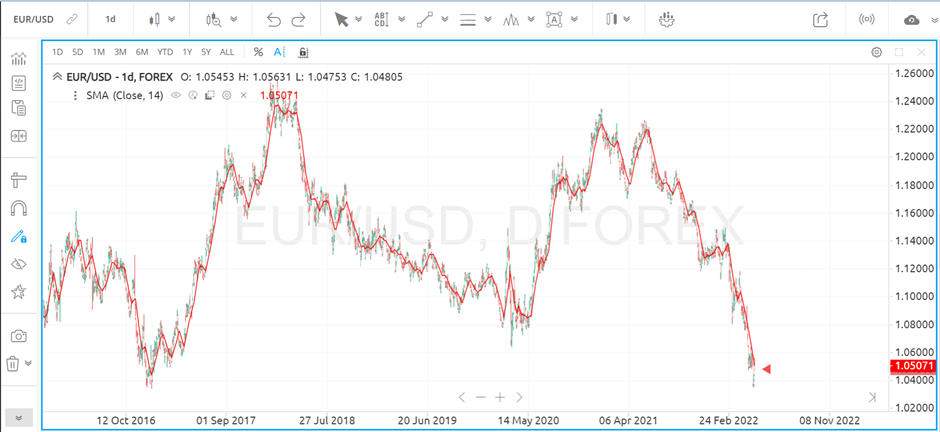
Here’s how it would look:

Source: MTI, SmartTrader
You’re almost there!
Now, modify the simple moving average to a period of 200. This means the simple moving average will consider the past 200 days or 200 historical candlesticks.
- To adjust the period, click on the settings button below the instrument name on your chart and change it to 200 days.
Voila! You now have a 200-period simple moving average displayed on your chart, like a guiding beacon.
Here’s a look:
Source: MTI, SmartTrader
What the example above shows is a red line representing the 200-period simple moving average on the chart.
Understanding the Simple Moving Average
What does this red line on the chart represent?
It’s the 200-period simple moving average, a valuable technical indicator. It calculates the average price of the currency pair (or any other instrument) over the specified period.
This ‘moving’ average is called so because it moves along the chart as the average value changes, forming a dynamic line.
Essentially, it indicates whether the price of an asset is likely to continue its current direction or reverse into a bull or bear trend.
Back to our EURUSD chart: If the market hovers above the lowest moving average point, we’re likely in a bullish trend. Conversely, if the market positions itself below the highest moving average point, a bearish trend could be on the horizon.
Applying Your Newfound Knowledge
The yellow circles on the red line in the chart reveal the lowest and highest moving average points.
Anything above these points signifies an uptrend, while anything below indicates a downtrend.
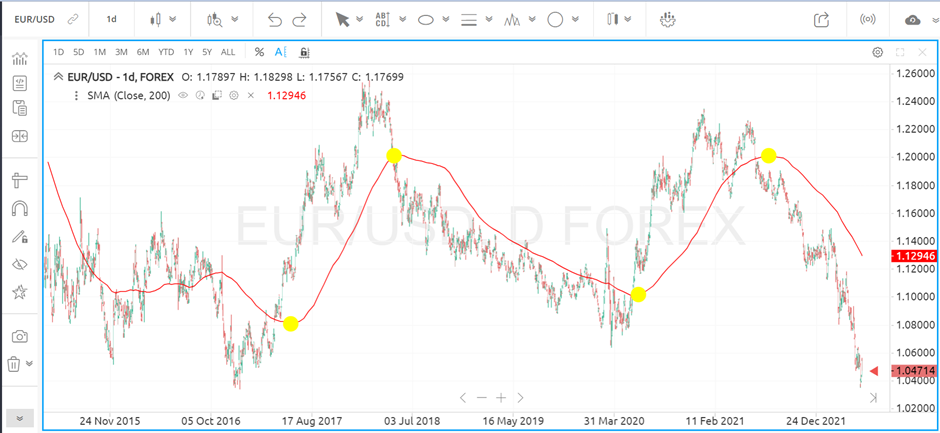
Source: MTI, SmartTrader
Any level above the lowest moving average points on the chart represents a bullish trend, and any level below the highest moving points represents a bearish trend.
With this information, you can determine your optimal entry and exit points.
For instance, if the current trend is downward, you may consider SELL on the EURUSD pair until the trend reverses.
In essence, you now have a straightforward and rapid approach to identifying high-probability trends in the Forex market.
This method serves as an excellent starting point for market analysis, helping you establish directional biases. Plus, you can apply it to any currency pair or financial instrument across various time frames.
So, go ahead and explore the market with newfound confidence and precision.
If you’re looking to ace your Forex trading game, check out SmartTrader Prime. It’s a powerful, cloud-based charting platform where you can create your ideal charting workspaces, access a range of indicators, and set custom alerts.
You can get your all-access pass to SmartTrader Prime by clicking here.
For more simple-to-apply Forex strategies such as above, download our FREE ebook – The Ultimate Indicators Guide. This expert guide shares senior analyst Tyson Clayton’s favorite tools that have helped this veteran pro find some of his most profitable trades. Click here to get your copy.
Some of the information presented may be provided by a third party. MTI is not responsible for any claims, products, services, or information provided by any third parties. MTI does not provide any warranty or representation as to any third party data. MTI expressly disclaims any responsibility and accepts no liability with respect to such third party information, services, and/or products. The third party data is provided for convenience only and is in no way meant to imply an endorsement by MTI or any other relationship.
Please see our full risk disclaimer.

