Scalp trading is all about taking small, quick profits on moves expected in the market. The scalper tries to make many (perhaps hundreds) of small profits on their trades each day. It takes a lot of concentrated effort to harvest profits from the markets this way. The goal of many retail scalpers is to turn a small amount of investing capital into a pile of profits by actively putting their money to work in this way.
Scalpers need to win about 75% of their trades which from a probability standpoint means they risk 3 to make 1. While this is a high winning percentage, the overall strategy will not be profitable unless the scalper also develops (or already has) additional ways to increase their trading edge (or simply “edge”). This article (and a series of additional articles) will discuss various techniques and tactics for getting additional edge using technical analysis.
Bollinger bands are one among hundreds of technical indicators which can be used by traders to dial in their entry and exit signals, increasing their edge and helping them achieve greater profitability with their trading. Scalpers increase their win rate when they trade with the trend.
Bollinger bands were created in the 1980s by John Bollinger. This indicator shows a high and low trading range based on a calculation based on standard deviation. Many traders wrongly believe that they should buy when the price hits the low band and sell when it hits the high band. But much research has been done to prove that this simplified approach doesn’t work.
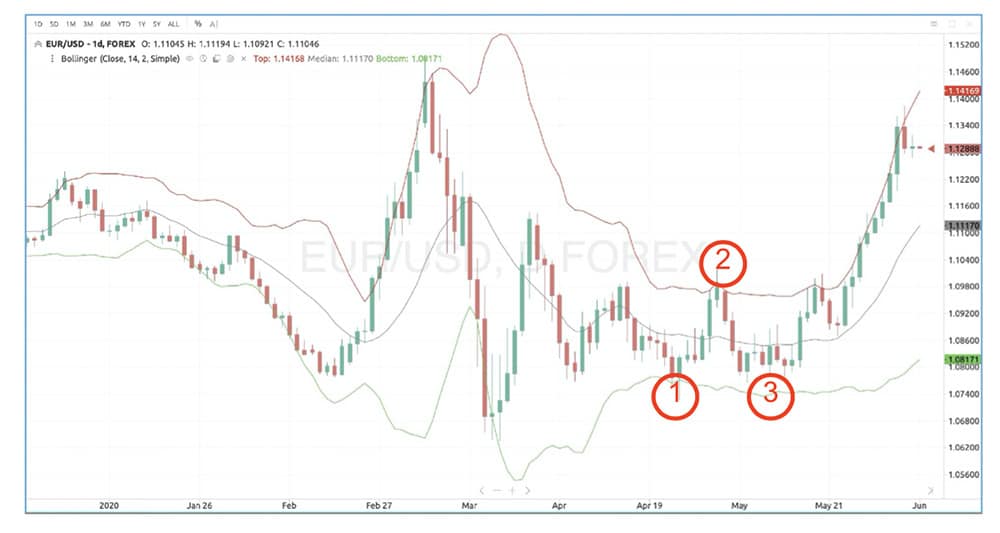
Here is a day chart of the EUR/USD:
 212
212
As can be seen, there are few instances where the price trades between the high or the low bar in any sort of consistent or predictable manner. John Bollinger himself felt like a better use of this indicator was to show changes in direction and to signal a new trend. He did not intend for these bands to act as some sort of limiting factor, instead he hoped to be able to predictably forecast change in direction with enough time to enter the trade for a profit.
Notice the period of time between points 1, 2, and 3. At point 1, the price touches the lower Bollinger band and immediately changes direction until it hits the upper band and bounces back down lower (the only time this happened on the entire chart). But look what happens at point 3…the price breaks down through the midline but does not touch the lower band before turning back around. A break back up above the middle line in a setup just like this indicates a new change in direction.
The Forex market is the world’s largest, most heavily traded market and is perfect for those who seek to scalp profits quickly. Those who choose to quickly take many small profits need to understand their trading style and the expected risks and rewards of their trades. They also need additional tools such as Bollinger bands to help them gain trading edge and improve their overall results and winning consistency.

