
Tad DeVan is a Senior Forex Analyst for Market Traders Institute and host of the Ignite Trading Room. Ignite Trading Room is FREE to join for active SmartTrader users.
The Stochastic RSI indicator can be used to identify entries in the market. Pro analyst Tad DeVan demonstrates how this tool works and why it could help you spot trades quickly.
Knowing if an asset is overpriced or underpriced can be of great help for traders. Understanding asset value can help them decide how it fares in comparison to other assets and whether it’s trading at the right price for its value.
Today, we will uncover a powerful indicator designed to calculate market price and also how you can use it to target potential profits.
Here we go…
Introducing Stochastic RSI
Stochastic RSI is a technical analysis indicator which is used to determine whether an asset is overbought or oversold, as well as to identify the market trends.
It lets you know when to buy a currency pair or any asset for that matter, at what levels, and when to exit the same.
As the name suggests, the stochastic RSI is a derivative of the standard Relative Strength Index (RSI), and therefore it is also considered an indicator of an indicator.
With that in mind, let’s review how you can use this tool to help you place trades…
Using Stochastic RSI
The main thing to look at when reading the stochastic RSI are the overbought and oversold conditions. These measurements are set at 0.80 for overbought conditions and 0.20 for oversold conditions.
And identifying these conditions is not as difficult as it sounds. All you have to do is find out if the stochastic RSI is moving below or above these conditions and you’re all set. Here’s how you can figure out overbought/oversold conditions in a snap…
Have a look at the RSI below the chart.
Stochastic RSI Indicating Oversold Zones
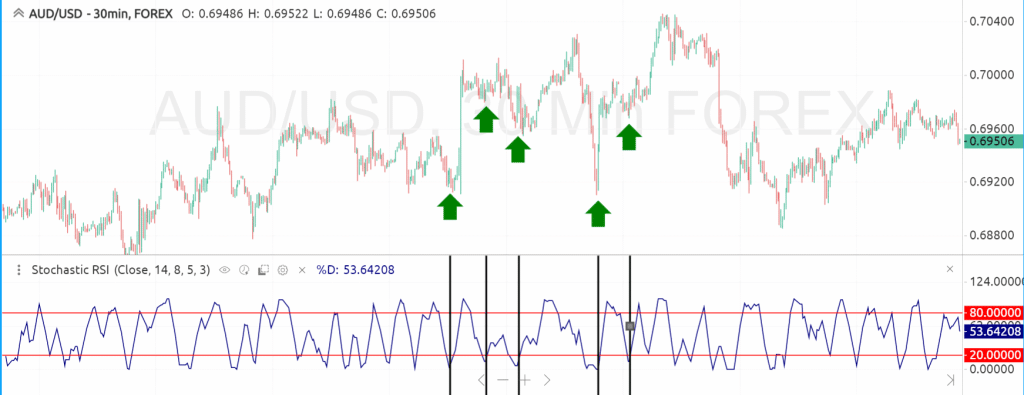
Whenever the blue line touches or moves below the lower red line, we know we are in an oversold zone and hence we can look to BUY at these levels.
We aim to buy because the market or asset doesn’t have much selling interest left at these levels and has greater chances of going up. And this setup works best when the asset or the market is in an uptrend.
Now have a look at the upper red line in the image below.
Stochastic RSI Indicating Overbought Zones

Whenever the blue line touches or moves above the upper red line, it indicates that we are in an overbought zone (or the markets are overbought) and hence we can look to SELL at these levels.
We aim to sell because the market or asset doesn’t have much buying interest left at these levels and has greater chances of falling. And this setup works best when the asset or the market is in a downtrend.
So, the two things to remember while using the RSI are…
- Look to Buy in an uptrend when we’re at or below the lower dotted line
- Look to Sell in a downtrend when we’re at or above the upper dotted line
Using Stochastic RSI on SmartTrader
Open up a new currency chart on your SmartTrader trading platform for which you want to know the stochastic RSI.
Next, go to the indicators list on the left hand side and click on the ‘Add Indicators’ button and search for ‘Stochastic RSI’ in the screen pop-up you get.
Finally, click on the ‘+’ button for the MTI Stochastic RSI and you’re all set!
You will now have the stochastic RSI indicator at the bottom of your chart. Here’s how it would look like:
The Stochastic RSI Indicator
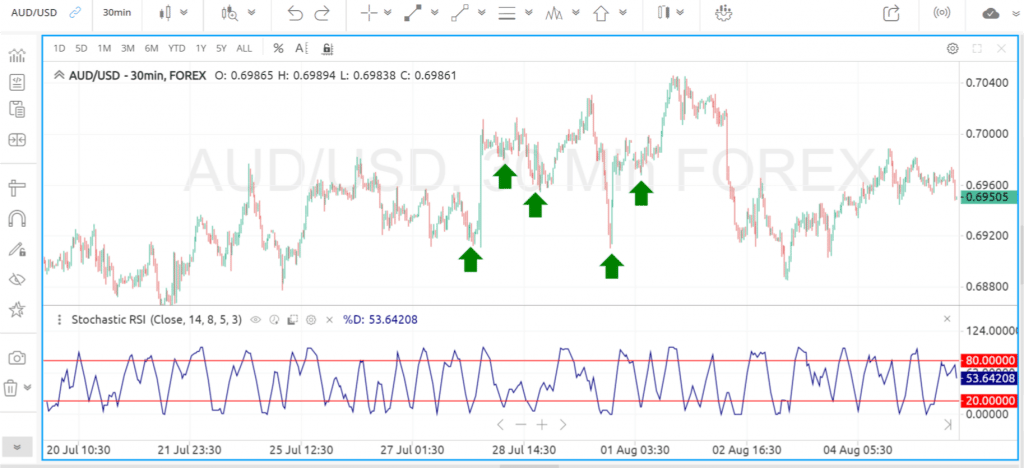
So, that’s why stochastic RSI is a simple way to help you identify if an asset is in an overbought or oversold zone and place trades accordingly to target potential profits.
Tad Devan, Senior Currency Strategist at Market Traders Institute, has also recorded a short video on this concept, which you can Watch Here.
For more such Forex strategies and trades, you can check out the Analyst On Demand Trading Room.
Every week, within the trading room, Tad will take you through real market conditions and help teach you the keys to being a consistent trader across the board. Just spend a little time in the trading room and we believe you could see great results for yourself. You can access it by clicking here >>
Trading foreign exchange on margin carries a high level of risk, and may not be suitable for everyone. Past performance is not indicative of future results. The high degree of leverage can work against you as well as for you. Before getting involved in foreign exchange you should carefully consider your personal venture objectives, level of experience, and risk appetite. The possibility exists that you could sustain a loss of some or all of your initial deposit and therefore you should not place funds that you cannot afford to lose. You should be aware of all the risks associated with foreign exchange trading, and seek advice from an independent financial advisor if you have any doubts. The information contained in this web page does not constitute financial advice or a solicitation to buy or sell any Forex contract or securities of any type. MTI will not accept liability for any loss or damage, including without limitation any loss of profit, which may arise directly or indirectly from use of or reliance on such information.

