
Did you get your copy of this 2-book bundle? It helps you manage risks without spending countless hours on charts. Give your Forex trades an edge – Get your essential guides here! And if you wish to meet our top analysts and discover their best trading moves, get yourself registered here.
A lot is going on with the U.S. debt lately.
The U.S. has hit its debt ceiling this year which has forced the Treasury Department to begin taking measures to continue paying the government bills.
The million dollar question for traders and investors is: How will it affect the markets and their money?
Let’s understand this, starting with some data and charts…
$31.4 Trillion Problem
$31.4 trillion! That’s a staggering figure and that’s how much the U.S. has reached in its debt obligations in January.
And Treasury Secretary, Janet Yellen, informed Congress that the cash on hand would last until early June.
How did this happen?
The simple answer is that the U.S. government spent more than it earned by borrowing more money to keep things rolling over the years.
Here’s a quick look at the government’s actual and estimated budget receipts, outlays, and deficits:
Source: whitehouse.gov
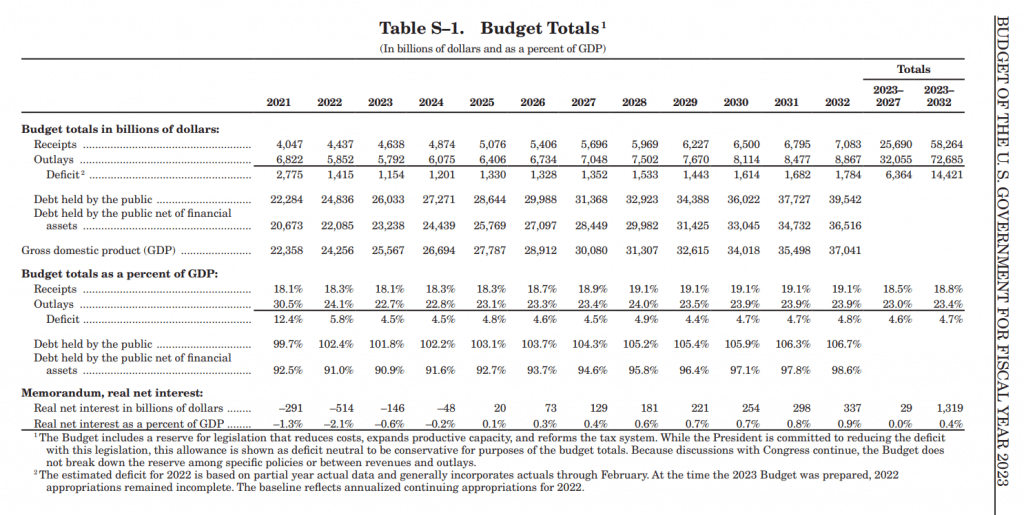
The U.S. government, which runs on a fiscal year that starts October 1st and ends on September 30th every year, funds much of its spending through debt, which is issued by the Treasury and the limit set for this is $31.4 trillion.
Treasury data shows it is running a deficit of $421.41 billion for its fiscal first quarter of 2023, a 12% increase from the fiscal first quarter of 2022.
To make sense of this data, economists like to assess the debt as a percentage of the gross domestic product (GDP) of a nation.
Here’s a look at how the U.S. debt has been over the last few years:
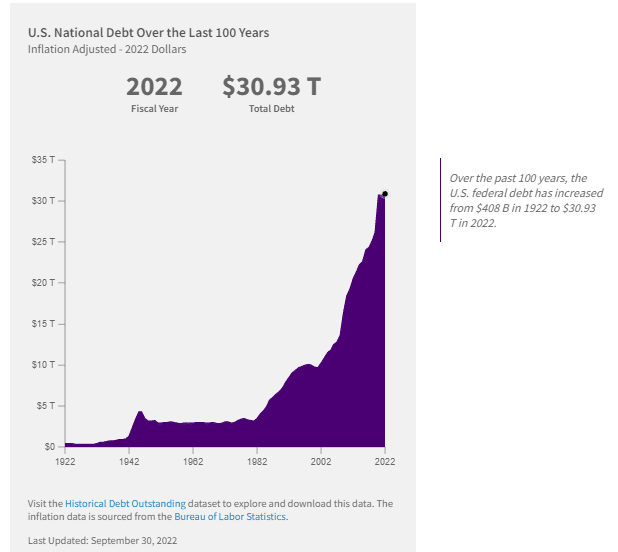
Source: fiscaldata.treasury.gov
And here’s how this compares with the GDP in percentage terms:
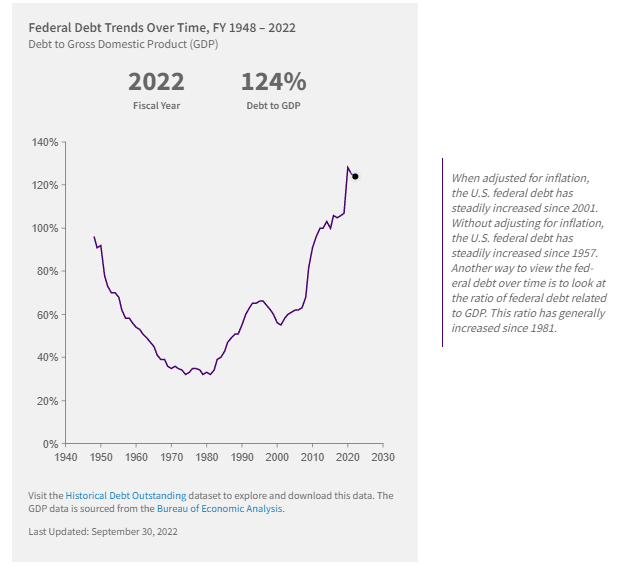
Source: fiscaldata.treasury.gov
That’s a whole lot of debt you’d say!
After the pandemic recovery spending, the debt currently is about 120% of GDP. That’s higher than after World War II, and this has prompted the Treasury Department to begin a series of extraordinary measures to continue borrowing until June.
Let’s understand why this happened by understanding how the debt ceiling works.
The Debt Ceiling
The debt ceiling is not a hard cap and is often raised to allow the government to continue borrowing in order to finance its spending.
When the government reaches the debt ceiling, it can no longer borrow money and must either raise the debt ceiling or find other ways to reduce its debt. If the debt ceiling is not raised, the government may risk default on its debt obligations or shut down certain programs in order to stay within the limit.
Raising this limit would allow the government to borrow more to cover spending already approved by Congress. Failure to raise the ceiling would mean the government would eventually fail to pay back its debts, including interest payments on Treasury bonds — technically putting the U.S. government in default.
Things start to get ugly when this limit is raised too many times and becomes a big debt pile for the nation.
Here are some latest updates on this:
The Treasury has been utilizing its remaining cash to pay the government’s bills on time. But this will end unless the Congress grants it the authority to resume borrowing the debt limit of $31.4 trillion.
House Speaker Kevin McCarthy proposed his plan to raise the debt ceiling by $1.5 trillion. It also included the proposal to cut federal non-defense spending.
Here’s how all this could impact the markets…
The general consensus is that the U.S. has never defaulted on its debt and will very likely take steps to avoid a default this time around as well. And because of its reputation, U.S. debt is considered a risk-free “safety asset” in the world economy.
However, shakiness in U.S. creditworthiness could potentially result in some market turmoil, like in 2011 when the U.S. faced a debt ceiling crisis and received a downgrade in its credit rating.
High levels of debt can also make it more difficult for the government to borrow money, as lenders may be less willing to lend to a country that already has too much debt.
A higher debt can also lead to increased inflation, as the government may be forced to print more money to pay off its debts. Increased inflation could mean decreased purchasing power for consumers and lower budgets and growth outlook from businesses.
Additionally, high levels of debt can make a country’s economy more vulnerable to external shocks.
According to Janet Yellen, if the new debt ceiling is not agreed upon and the U.S. defaults on its debt, it could lead to an economic and financial catastrophe.
For traders and investors, the current developments around the U.S. debt can potentially lead to more volatility in the markets.
It could also lead to higher interest rates as lenders demand higher returns to compensate for the increased risk. And this could further make it more expensive for businesses and consumers to borrow money and can slow the economic growth.
It’s important to note that the U.S. debt is not necessarily a bad thing as long as it is used to invest in infrastructure, education and other things that can boost long-term economic growth.
The current development on the matter is that the Congress must pass legislation to raise or suspend the debt ceiling of $31.4 trillionsoon or risk failing to pay its bills.
It could also bring potentially major market implications in the coming months.
Our top analysts are closely monitoring these trends and when they see any exciting opportunities to potentially target profit from, you will be the first to hear from them.
They have a few exciting setups for the current market. Click here to join them LIVE today.
And don’t forget to check out our Forex Cheat Sheet that helps you find crucial market levels on your charts! Click here to download it >>
Predictions are not a guarantee of this or any result. Information provided on this prediction is for general information purposes only. We offer no representation or warranty with regard to this prediction. No prediction is personalized or otherwise directed at any individual or particular circumstances. We disclaim and will not accept any liability for losses associated with this prediction.
Some of the information presented may be provided by a third party. MTI is not responsible for any claims, products, services, or information provided by any third parties. MTI does not provide any warranty or representation as to any third party data. MTI expressly disclaims any responsibility and accepts no liability with respect to such third party information, services, and/or products. The third party data is provided for convenience only and is in no way meant to imply an endorsement by MTI or any other relationship.
Please see our full risk disclaimer.

